|
「这是我参与11月更文挑战的第25天,活动详情查看:2021最后一次更文挑战」
使用python-networkx实践社交网络可视化
01 使用networkx制作图网络模型
使用networkx创建图,添加结点和边
查看邻接矩阵/邻接表/图热力图
图网络赋权
图网络统计量(出度和入度、最短路径)
导包
import networkx as nx
import matplotlib.pyplot as plt
import collections
import random
import numpy as np
from pylab import rcParams
import warnings
warnings.filterwarnings("ignore")
# 支持中文
plt.rcParams['font.sans-serif'] = ['SimHei'] # 用来正常显示中文标签
plt.rcParams['axes.unicode_minus'] = False # 用来正常显示负号
添加节点
# 添加结点
G = nx.Graph() # 创建一个空的无向图 创建有向图使用nx.DiGraph()
G.add_node(1) # 创建单个节点
G.add_nodes_from(range(10)) # 创建一组节点
nx.draw(G,node_color="darkblue")

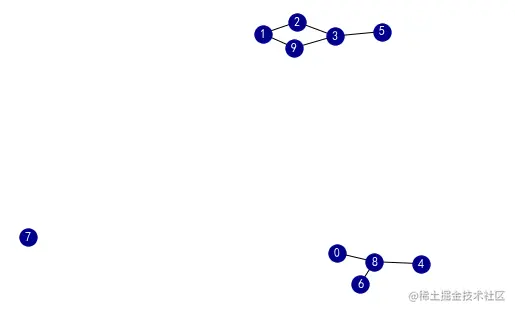
添加边
G.add_edge(1,2)
e = [(2,3),(9,3),(8,4),(3,5),(8,6),(0,8),(1,9)]
G.add_edges_from(e)
nx.draw(G,with_labels=True,node_color="darkblue",font_color="white")
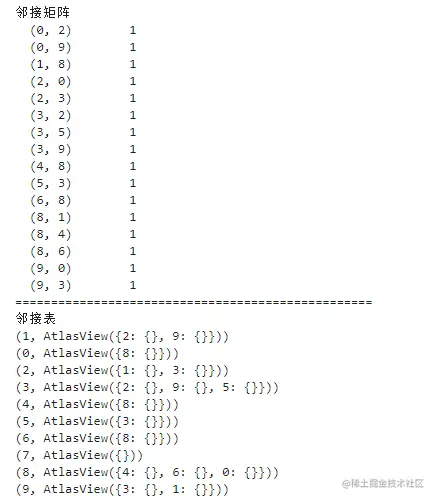
打印邻接矩阵和邻接表
# 打印邻接矩阵
print("邻接矩阵")
print(nx.adjacency_matrix(G))
print("="*50)
print("邻接表")
for i in G.adj.items():
print(i)
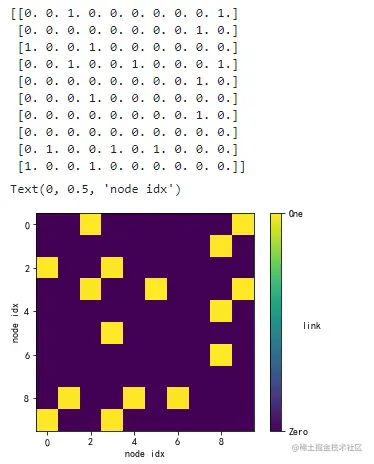
热力图
# 邻接矩阵的热力图:反应稀疏程度
print(nx.to_numpy_matrix(G)) #转换邻接矩阵为numpy格式
plt.imshow(nx.to_numpy_matrix(G)) #创建2维热力图
cbar = plt.colorbar() #--> 设置colorbar热力图题注
cbar.set_ticks([0,1]) #--> 设置colorbar刻度范围
cbar.ax.set_yticklabels(['Zero','One'],) #--设置colorbar刻度轴首尾坐标名
cbar.set_label('link', rotation=0) #--设置colorbar坐标名
plt.xlabel('node idx') #--设置 x 轴
plt.ylabel('node idx') #--设置 y 轴
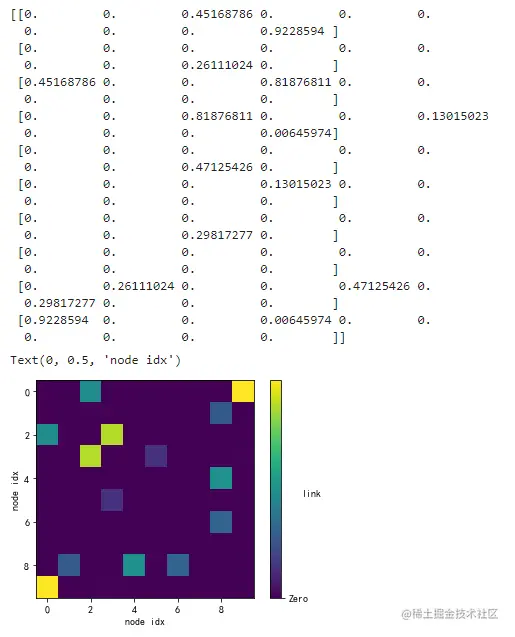
赋权
# 赋权
for e in G.edges():
G[e[0]][e[1]]['weight'] = random.uniform(0, 1) # 使用uniform分布给已存在的关系重新赋权
print(nx.to_numpy_matrix(G))
plt.imshow(nx.to_numpy_matrix(G))
cbar = plt.colorbar() #--> 设置colorbar热力图题注
cbar.set_ticks([0,1]) #--> 设置colorbar刻度范围
cbar.ax.set_yticklabels(['Zero','One'],) #--设置colorbar刻度轴首尾坐标名
cbar.set_label('link', rotation=0) #--设置colorbar坐标名
plt.xlabel('node idx') #--设置 x 轴
plt.ylabel('node idx') #--设置 y 轴
网络统计量
##### 网络统计量
# 度
G =nx.karate_club_graph() # 创建一个空手道成员俱乐部图 :这是一个非常有名的社交网络图
degree_sequence = sorted([d for n, d in G.degree()], reverse=True) # 保存每个结点的度,并按降序排列
print("度 排列", degree_sequence)
print("= "*50)
degreeCount = collections.Counter(degree_sequence) # 计算每种度的数目
print("度 频率", degreeCount)
print("= "*50)
deg, cnt = zip(*degreeCount.items()) # 创建一个迭代器
rcParams['figure.figsize'] = 12, 8 # 设置画板全局大小
fig, ax = plt.subplots() # 创建子图
plt.bar(deg, cnt, width=0.80, color='darkblue')
plt.title("度 直方图")
plt.ylabel("频率")
plt.xlabel("度")
plt.axes([0.4, 0.4, 0.5, 0.5])
plt.axis('off')
ax.set_xticks([d + 0.4 for d in deg])
ax.set_xticklabels(deg)
pos = nx.spring_layout(G) #-- 设置网络布局
nx.draw_networkx_nodes(G, pos, node_color= 'darkblue',node_size=20) # 画图
nx.draw_networkx_edges(G, pos, alpha=0.5) # 画边
plt.show()
print('无向图的度均值:', np.mean(G.degree()))
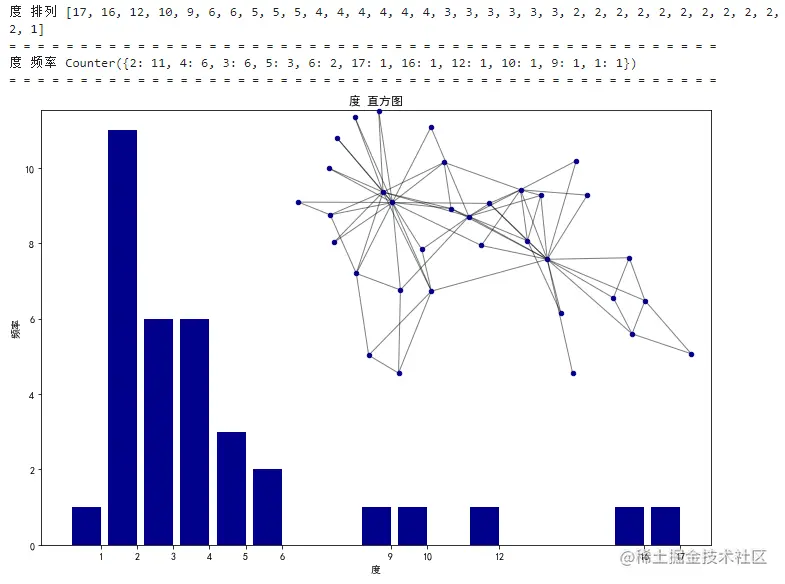
无向图的度均值: 10.544117647058824
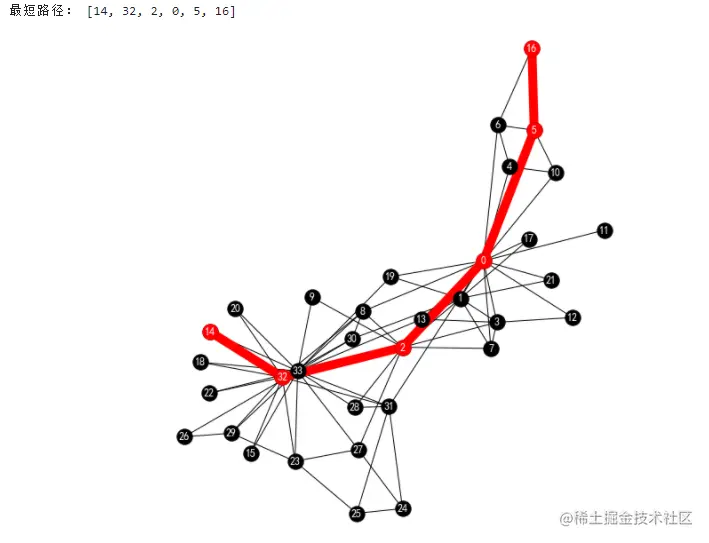
最短路径
# 最短路径
R = nx.karate_club_graph()
source=14 # 选一个点做起点
target=16 # 选一个点做终点
# 最短路径作图函数
def short_path_plot(G,source,target):
pos = nx.spring_layout(G) #-- 设置网络布局
nx.draw(G,pos,node_color='k', with_labels=True, font_color='white') #-- 画图结构
path = nx.shortest_path(G,source=14,target=16) #-- 调用shortest path计算最短路径
print("最短路径:",path)
path_edges = list(zip(path,path[1:])) #-- 创建最短路径边
nx.draw_networkx_nodes(G,pos,nodelist=path,node_color='r', label=True) #-- 画结点
nx.draw_networkx_edges(G,pos,edgelist=path_edges,edge_color='r',width=10) #--画边
plt.axis('equal')
plt.show()
return
#调用函数
short_path_plot(R,source,target)
02 网络结构
随机图
小世界模型
无标度网络
# 下载 幂律分布 包
# !pip install powerlaw
import re
import powerlaw
import seaborn as sns
from operator import itemgetter
# 直方图绘制
def draw_hist_network(G):
degree_sequence = sorted([d for n, d in G.degree()], reverse=True)
degreeCount = collections.Counter(degree_sequence)
deg, cnt = zip(*degreeCount.items())
rcParams['figure.figsize'] = 10, 5
fig, ax = plt.subplots()
plt.bar(deg, cnt, width=0.80, color='darkblue')
plt.title("度 直方图")
plt.ylabel("频率")
plt.xlabel("度")
ax.set_xticks([d + 0.4 for d in deg])
ax.set_xticklabels(deg)
plt.axes([0.4, 0.4, 0.5, 0.5])
Gcc = G.subgraph(sorted(nx.connected_components(G), key=len, reverse=True)[0])
pos = nx.spring_layout(G)
plt.axis('off')
nx.draw_networkx_nodes(G, pos, node_color= 'darkblue',node_size=20)
nx.draw_networkx_edges(G, pos, alpha=0.4)
plt.show()
pass
# 网络绘制
def draw_network(G,name):
plt.title(name)
pos = nx.circular_layout(G)
nx.draw_networkx_nodes(G, pos, node_color= 'darkblue',node_size=20)
nx.draw_networkx_edges(G, pos, alpha=0.4)
plt.axis('off')
plt.show()
pass
随机图
# 生成随机图
nodes_n=50
degree=20
simulation_number=10
rcParams['figure.figsize'] = 5, 5
#连通率 = 0.01:
#------------------------------
G = nx.random_regular_graph(degree,nodes_n) # |